
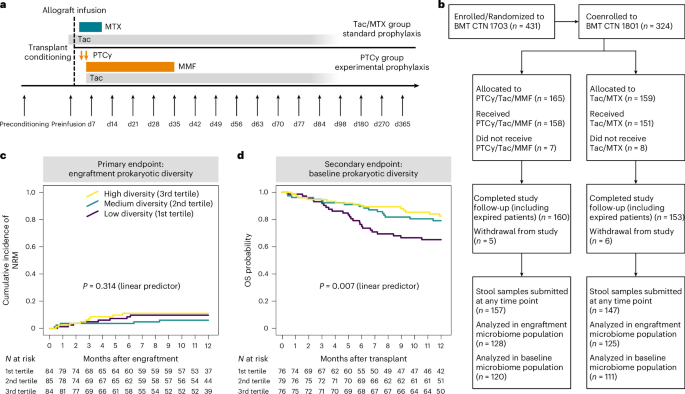
BMT CTN 1801 study design
In the BMT CTN 1703 study, participants were randomized into two groups: the Tac/MTX arm received the standard GVHD prophylaxis regimen MTX and tacrolimus (Tac), and the PTCy arm received the experimental prophylaxis consisting of cyclophosphamide at days 3 and 4 after transplant, followed by mycophenolate mofetil (MMF) and Tac (Fig. 1a). All participants received reduced-intensity conditioning before allo-HCT.

a, Schematic representation of the BMT CTN 1801 study, showing the GVHD prophylaxis received in the two study arms. Sampling timepoints are indicated by arrows below the timeline. b, CONSORT diagram showing the number of individuals coenrolled in BMT CTN 1801, their GVHD prophylaxis arm allocation and inclusion in engraftment or baseline microbiome analyses. c, Visualization of the cumulative incidence of NRM, separated by the tertiles of microbial diversity (determined using Shannon’s index) at engraftment. d, Kaplan–Meier probability curves for OS, separated by the tertiles of microbial diversity (determined using Shannon’s index) at baseline. For c,d, the P value was determined using a two-sided Wald test.
The BMT CTN 1801 study was a companion study to BMT CTN 1703, sharing clinical trial registration and participant population. In total, 324 of the 431 BMT CTN 1703 participants coenrolled in BMT CTN 1801, of whom 304 donated at least one stool sample over the course of the study (Tac/MTX n = 147, PTCy n = 157; Fig. 1b). The most common primary diseases were acute myelogenous leukemia (n = 152, 50.0%) and myelodysplastic syndrome (MDS, n = 92, 30.3%; Table 1). The study was conducted between 23 July 2019 (first participant enrollment) and 18 June 2021 (last participant enrollment).
As part of the trial, 2,575 stool samples were collected and metagenomically sequenced, with most participants donating 6 samples over the course of their enrollment (Extended Data Fig. 1). Microbiome alpha diversity was determined using Shannon’s index on species-level taxonomic profiles generated with the mOTUs21 profiler (Methods).
All prespecified primary and secondary outcomes related to the gut microbiome are presented in the following sections. Specifically, evaluating the association between microbiome diversity at neutrophil engraftment and non-relapse mortality (NRM) was the primary outcome. The secondary outcomes encompassed the evaluation of microbiome diversity at engraftment and other clinical outcomes (relapse/progression, acute GVHD grade II–IV, acute GVHD grade III–IV, any grade chronic GVHD, moderate/severe chronic GVHD, OS and GVHD-free relapse-free survival) and the association between microbiome diversity at baseline and all clinical outcomes. The last group of secondary outcomes were to evaluate the associations between antimicrobial exposure during the first 30 days following HCT and all clinical outcomes. Additional results of BMT CTN 1801 related to T cell receptor sequencing are published in a companion manuscript (S. J. Siegel et al., manuscript in preparation).
Primary outcome: association between microbiome diversity at engraftment and NRM
The prespecified primary objective of the BMT CTN 1801 study was to evaluate the association between microbiome diversity at neutrophil engraftment and NRM after 1 year. The engraftment timepoint was defined as the first of 3 days that the absolute neutrophil count reached ≥500 cells per microliter blood for 3 consecutive days. Stool samples donated closest after, but within 14 days of, the engraftment day were selected for this analysis. On average, engraftment occurred slightly later in the PTCy group (mean = 15.3 days) compared to the Tac/MTX group (mean = 14.6 days). Microbiome alpha diversity at engraftment was not significantly associated with the cumulative incidence of NRM, either considering diversity categorized by tertiles (P = 0.520, Fine–Gray model; Fig. 1c) or treated as a continuous, linear effect (P = 0.314, Fine–Gray model; Table 2).
Secondary outcomes: associations between microbiome diversity and other clinical outcomes
Similar to NRM, no significant associations with other clinical outcomes were observed for the microbiome diversity at engraftment (Table 2 and Extended Data Fig. 2). The GVHD prophylaxis arm was included as a term in the model (Methods), demonstrating that engraftment diversity was not associated with these outcomes after accounting for the effect of treatment arm.
In another prespecified secondary analysis, we assessed the associations between baseline microbiome diversity (calculated on all preconditioning samples) and clinical outcomes. At baseline, we found several clinical outcomes to be associated with microbiome diversity. Compared to the highest diversity tertile, OS was significantly shorter in the lowest tertile diversity group (P = 0.031, hazard ratio (HR) = 0.47, Cox proportional hazard model; Supplementary Table 1). Similarly, lower baseline diversity was associated with shorter OS as a linear predictor (P = 0.007, HR = 0.63, Cox proportional hazard model; Fig. 1d). The composite primary outcome measure of the BMT CTN 1703 study, GRFS, was similarly associated with baseline microbiome diversity when treating it as a continuous predictor (P = 0.047, HR = 0.79, Cox proportional hazard model).
An additional prespecified secondary analysis investigated the associations between antimicrobial exposure during the first 30 days following HCT and clinical outcomes. Participants were dichotomized based on the number of antibacterial doses received (Methods). Similar to microbiome diversity, most outcomes were not strongly associated with antimicrobial exposure. One notable exception was that the group with higher exposure to antibacterials was at a higher risk for acute GVHD grade II–IV (P = 0.006, HR = 2.6; Supplementary Table 1), which is in line with previous reports22.
In summary, microbiome diversity at engraftment was not significantly associated with any clinical outcome in this study, in contrast to prior studies that included participants with a wider array of conditioning regimen intensity11. Baseline microbiome diversity, though, was associated with OS and other outcomes.
Safety
Safety analyses were conducted and reported in the publication for the companion study BMT CTN 1703 (ref. 8). A detailed list of adverse events observed in BMT CTN 1801 participants is available in Extended Data Table 1. Overall, Grade 3–5 Cardiac and Grade 3–5 Gastrointestinal Disorders were the most common adverse events. Out of 324 participants coenrolled in BMT CTN 1801, there were 71 deaths over the course of the study (Supplementary Table 2).
Sensitivity analysis
For 34 participants, the absolute neutrophil count never declined below 500 cells per microliter during the course of the study. Following the prespecified analysis plan, the engraftment timepoint for these non-neutropenic participants was set to the first day following HCT, possibly resulting in the selection of an inappropriately early stool sample for the primary endpoint analysis. To address this potential limitation, we performed a sensitivity analysis in which we selected the day-14 stool sample for non-neutropenic participants as the relevant sample to assess microbiome diversity at engraftment, because engraftment in other participants occurred close to day 14 on average. The resulting models similarly revealed a lack of consistent significant associations between engraftment microbiome diversity and clinical outcomes (Supplementary Table 1).
Post hoc analyses: microbiome alpha diversity and absolute microbial load
To explore the general microbiome state of participants over time, we compared the influence of GVHD prophylaxis on diversity trajectories. At baseline, there was no difference in alpha diversity between groups (P = 0.410, Wilcoxon rank-sum test). For comparison with previous reports11, we also visualized the inverse Simpson index (P = 0.363, Wilcoxon rank-sum test; Extended Data Fig. 3). As expected, diversity declined after allo-HCT in both arms. However, it declined more in the PTCy arm than in the Tac/MTX arm (Fig. 2a). The largest difference between arms was observed between 14 and 28 days following HCT (Shannon P = 0.038, inverse Simpson P = 0.011, linear mixed-effect model with participant ID as random effect).

a,b, Microbiome alpha diversity (calculated as Shannon’s index) (a) and predicted or measured 16S rRNA gene copy number per extraction (b) shown over time for all included stool samples (PTCy n = 1,184, Tac/MTX n = 1,125). Samples are binned by collection timepoint and jittered across the x axis. The trendline for each study arm was estimated using a locally estimated scatterplot smoothing model with the formula y ≈ x, with the gray area showing the 95% confidence interval. c, Cumulative percentage of participants exposed to any antimicrobial medication up to day 35 following HCT, split by treatment arm. Difference between distributions was calculated with a two-sided log-rank test (PTCy n = 157, Tac/MTX n = 147). d, Number of antimicrobial doses up to day 35 per participant (PTCy n = 157, Tac/MTX n = 147) shown as box plots. Difference between treatment arms was tested with a two-sided Wilcoxon rank-sum test. Boxes show the interquartile range (IQR) with vertical lines extending up to 1.5 × IQR and the median as thick black line. e, Percentage of stool samples (PTCy n = 321, Tac/MTX n = 295) from timepoints 14–28 following HCT that were either not exposed (naive) or had been exposed to non-prophylaxis antibiotics in the 7 days before sampling, shown for both treatment arms as bars. f, Predicted or measured 16S rRNA gene copies per extraction for samples from e, shown as box plots for all samples per treatment arm (PTCy n = 321, Tac/MTX n = 295). Additionally, values are shown as points, colored by non-prophylaxis antibiotics exposure. Thick horizontal bars represent the median within groups. Boxes show the IQR with vertical lines extending up to 1.5 × IQR. For the point clouds, vertical lines represent the IQR. Difference between groups was tested with a linear mixed-effect model using GVHD prophylaxis (arm) and non-prophylaxis antibiotics exposure (abx) as fixed effects and participant ID as random effect. The P value for the model was determined using a two-sided t-test using Satterthwaite’s method. PCON, preconditioning; PINF, preinfusion of hematopoietic cells.
In addition to overall diversity, the absolute microbial load in a sample is hypothesized to be a key ecological factor of importance in the gut microbiome23. We therefore determined the number of 16S ribosomal RNA (rRNA) gene copies per DNA extraction, where DNA was extracted from a fixed volume of stool, as a proxy for microbial load. We used a combination of experimental and machine learning techniques24 (Methods and Extended Data Fig. 3): the number of 16S rRNA copies was measured directly for 858 samples (~30% of the complete dataset) via digital droplet polymerase chain reaction (PCR); the remaining values were predicted using a benchmarked and validated machine learning model24. Similar to diversity, we observed no difference between groups at baseline (P = 0.851, Wilcoxon rank-sum test), followed by a drop in absolute microbial load after allo-HCT, which was more pronounced in the PTCy group (Fig. 2b and Extended Data Fig. 3). Between days 14 and 28 following HCT, the microbial load in the PTCy group was, on average, smaller by a factor of 2 than that in the Tac/MTX group (mean 16S rRNA copies PTCy = 108.59, Tac/MTX = 108.92, P = 3 × 10⁻⁵, linear mixed-effect model with participant ID as random effect, number of samples: PTCy = 321, Tac/MTX = 295).
We initially hypothesized that this observed difference in diversity and absolute microbial load could be driven by differences in antibiotic exposure between groups. In most clinical centers, individuals undergoing allo-HCT are prescribed prophylactic antibiotics as part of standard practice and, if they develop signs suggestive of infection, are later switched to more broad-spectrum agents. In fact, the initial BMT CTN 1703 study8 reported higher incidence of grade 2 infection events in the PTCy group, potentially resulting in the prescription of more antimicrobial agents. However, the number of participants initially exposed to antibacterials up to day 35 was similar between treatment arms (P = 0.063, log-rank test; Fig. 2c) and the number of antibacterial doses up to day 35 following HCT was not significantly higher in the PTCy group (P = 0.630, Wilcoxon rank-sum test; Fig. 2d). Focusing on individual antibacterial classes, we similarly did not observe significantly higher overall exposure or number of doses that could explain the observed difference in absolute microbial load (Extended Data Fig. 4).
To further explore the potential impact of antibiotics on absolute microbial load and diversity, we compared the number of stool samples collected after participants were exposed to non-prophylaxis antibiotics (Methods). We found an excess of non-prophylaxis antibiotic exposure in the PTCy group (P = 0.028, Fisher’s exact test; Fig. 2e), mostly driven by administration of cefepime (Extended Data Fig. 5). However, even after adding a term for non-prophylaxis antibiotics to the linear mixed-effect model, the microbial load was still different between treatment arms on days 14-28 post-HCT (P = 7 × 10⁻⁵; Fig. 2f). For microbial diversity, including a term for antibiotics alleviated the contribution of the study arm in the model for Shannon (P = 0.080) but not for inverse Simpson diversity (P = 0.024). This suggests that the difference in antibiotic exposure alone is not driving the observed difference in absolute microbial load.
Taken together, gut microbiome diversity was lower after allo-HCT, in line with previous reports11. We also found that absolute microbial load was decreased in the weeks following HCT. Both the diversity and absolute load reduction were stronger in the PTCy group compared to the Tac/MTX group, but these divergencies could not be fully explained by differences in exposure to antimicrobial agents.
Post hoc analyses: microbial domination events
In addition to lower microbial diversity, domination by a single microbial taxon (>30% of relative abundance explained by a single bacterial genus) is common after allo-HCT10,11,25. To quantify microbial domination in the BMT CTN 1801 population, we calculated the rate of domination on the species level over time (Fig. 3a). In agreement with previous studies, microbial domination was commonly observed in both study arms, with ~50% of samples showing domination at day 14 following HCT. Despite domination appearing more commonly in the Tac/MTX arm in later timepoints, there was no significant enrichment for dominated samples across GVHD prophylaxis arms over time (q > 0.05 for all timepoints; Fisher’s exact test after Benjamini–Hochberg correction).

a, Percentage of samples showing microbial domination (a single microbial species with relative abundance >30%), shown for both treatment arms up to day 365. For all timepoints, differences between treatment arms were not significant as tested by a two-sided Fisher’s exact test. Numbers at the top indicate the number of samples at the given timepoint. b, Number of samples with domination by commonly dominating bacteria shown as bars, separated by treatment arm. Differences between treatment arms were tested with Fisher’s exact test, followed by Benjamini–Hochberg correction. q values > 0.05 not annotated. c, Abundance distribution across all samples for species shown in b. d, Predicted or measured 16S rRNA gene copy number per extraction for samples dominated by species shown in b. Numbers at the top indicate the number of samples shown and the q values for the comparison to the ‘not dominated’ group (Wilcoxon rank-sum test followed by Benjamini–Hochberg correction). Boxes show the IQR, with vertical lines extending to 1.5 × IQR and horizontal thick lines indicating the median. Except for the ‘not dominated’ and ‘other’ groups, all data points are shown. e, HRs (diamonds) with 95% confidence intervals (CIs; lines) for Fine–Gray and Cox regression models, investigating the association between microbial domination and clinical outcomes. P values were determined with a two-sided Wald test; P > 0.05 not annotated; * indicates P = 0.012. cGHVD, chronic GVHD, aGVHD, acute GVHD, mod./s., moderate to severe.
Among the most common bacterial species accounting for domination were pathogens such as Enterococcus faecium, Enterococcus faecalis, Escherichia coli and Klebsiella pneumoniae (Fig. 3b), as well as commensal organisms such as Ruminococcus gnavus, a mucin-degrading species observed to dominate the microbiome of individuals with inflammatory bowel disease26. Additionally, two Akkermansia species and Blautia caecimuris commonly dominated the microbiome, with B. caecimuris domination being more common in the Tac/MTX group (q = 0.0001, Fisher’s exact test after Benjamini–Hochberg correction; Fig. 3b). Finally, Lactobacillus rhamnosus and Streptococcus thermophilus, two species used in dairy products and probiotics, were also commonly involved in domination events.
To better understand the observed domination events, we investigated the abundance distribution of commonly dominating species (Fig. 3c). Four species (B. caecimuris, R. gnavus and the two Akkermansia species) were found to be highly abundant (median relative abundance >1%) in both dominated and non-dominated samples, suggesting that domination by those species might not necessarily be indicative of a highly disrupted microbiome state (see also Extended Data Fig. 6). On the other hand, L. rhamnosus and S. thermophilus were usually observed at the lower end of the relative abundance spectrum, when present (median relative abundance L. rhamnosus, 54-fold lower for S. thermophilus; Fig. 3d). This could indicate that domination by those species might represent not microbial blooms but rather states of community collapse in which microbes provided through the diet become a substantial component of the DNA detected in stool.
Samples dominated by pathogens fell in the middle of this spectrum: some samples reached both complete domination by a single species as well as comparably high absolute microbial load (Extended Data Fig. 6), whereas other samples were dominated yet showed lower microbial load overall. This suggests that some domination events represent microbial blooms by enteric pathogens, whereas others are likely the consequence of the ‘collapse’ of other microbial components within these communities.
Because microbial domination is considered as a ‘dysbiotic’ state that might be indicative of poorer general health, we tested whether microbial domination events were associated with long-term clinical outcomes. We focused on domination at days 14 and 21 following HCT, as domination was most common on those days, and additionally investigated domination with enteric pathogens (E. coli, K. pneumoniae, E. faecium and E. faecalis) at day 21 (Extended Data Fig. 6). However, we did not observe consistently significant associations between microbial domination and long-term clinical outcomes (Fig. 3e).
Overall, microbial domination events peaked after allo-HCT, in line with expectations from previous studies, but were not associated with long-term clinical outcomes. Domination events involved blooms of not only enteric pathogens such as E. faecium10 but also microbes with high abundance in non-dominated samples and potentially diet-derived microbes. This suggests that the ecological paths to domination and the likely consequences of microbial domination are varied.
Post hoc analyses: gut microbiome differences between treatment arms
To explore the association of GVHD prophylaxis with the microbiome, we identified species with differential abundance between treatment arms, adjusting for exposure to non-prophylaxis antibiotics (Methods). As expected, no differences were found at baseline (Extended Data Fig. 7), and similarly, no species were differentially abundant when considering all data across the full study period (using q = 0.01 threshold; Extended Data Fig. 7).
Focusing on days 14–28 following HCT, we found several species with significantly lower abundance in the PTCy arm compared to the Tac/MTX arm. The species with the largest difference between treatment arms was Clostridium scindens (Fig. 4a,b), with other Clostridia species showing a similar pattern. The only species with significantly higher abundance in PTCy compared to Tac/MTX, Streptococcus mutans, is a predominantly oral-resident bacterium with comparably low relative abundance in stool (Fig. 4c). Other oral taxa also showed a (non-significant) enrichment in PTCy over Tac/MTX (Supplementary Table 3), potentially reflecting a slight increase in transmission of oral bacteria to the gut27 in the PTCy arm.

a, Volcano plot showing the significance and effect size (line model coefficient) for comparing the relative abundance of individual bacterial species between PTCy and Tac/MTX, using stool samples collected in days 14–28 following HCT (PTCy n = 321, Tac/MTX n = 295). Linear mixed-effect models were constructed with participant ID as random effect. Dots represent individual microbial species, colored by their Genome Taxonomy database class annotation. b, Prevalence trajectory for C. scindens across study arms. c, Log-transformed relative abundance distribution for species highlighted in a, separated by study arm (PTCy n = 321, Tac/MTX n = 295). Boxes show the IQR, with vertical lines extending to 1.5 × IQR and horizontal thick lines indicating the median. Outliers are shown as dots. d, Log-transformed relative abundance of secondary bile-acid metabolism pathways for samples collected between days 14–28 following HCT, separated by study arm (PTCy n = 321, Tac/MTX n = 295). Box plot definition as in c; all data are shown as dots. The P value for the linear mixed-effect model was determined using a two-sided t-test using Satterthwaite’s method. e, Visualization of the cumulative incidence for chronic GVHD, separated by study arm and presence or absence of secondary bile-acid metabolism pathways at days 14–28 following HCT. Association between chronic GVHD and group (study arm and secondary bile-acid presence) was tested using a Fine–Gray model with death as competing risk. See Supplementary Table 4 for model details.
C. scindens has the capacity to modify host-derived primary bile acids into secondary bile acids via the bai operon28. In particular, C. scindens can perform 7α/β-dehydroxylation of primary bile acids, resulting in deoxycholic and lithocholic acid. Secondary bile acids and their myriad derivatives are regulators of host immune states, acting both on the innate and adaptive immune systems by inducing the differentiation of regulatory T cells29.
We therefore asked whether the lower prevalence of C. scindens was also reflected in a functional, gene-based analysis of the metagenomic sequencing data (Methods). Interestingly, secondary bile-acid metabolism pathways were the only pathways with significantly lower abundance in the PTCy arm at days 14–28 following HCT at q 4d and Extended Data Fig. 7). There is incomplete correspondence between the presence of secondary bile-acid metabolism pathways and of C. scindens: the detection of metabolic pathways appears to be less sensitive, but more specific, than the quantification of C. scindens abundance from taxonomic profiling (Extended Data Fig. 8).
Given the ability of bile acids to modulate the host’s immune system, we asked whether the presence of C. scindens or of secondary bile-acid metabolism pathways at days 14–28 following HCT was associated with clinical outcomes. The presence of C. scindens was not associated with clinical outcomes (Supplementary Table 4), whereas the presence of secondary bile-acid metabolism pathways during days 14–28 was associated with lower risk for developing chronic GVHD (Fig. 4e, Extended Data Fig. 8 and Supplementary Table 4). Interestingly, the presence of secondary bile-acid metabolism pathways corresponded to lower chronic GVHD risk mostly in the Tac/MTX arm, resulting in chronic GVHD incidence similar to PTCy-based GVHD prophylaxis.
This analysis revealed that PTCy and Tac/MTX treatment are associated with different states of microbiome disruption at days 14–28 following HCT, with participants in the PTCy arm exhibiting lower prevalence of potentially beneficial Clostridia species, especially bile-acid-modifying C. scindens. The association between secondary bile-acid metabolism pathways and chronic GVHD risk was observed predominantly in the Tac/MTX group. This suggests that a potential modulation of T cell alloreactivity by microbiome-derived secondary bile acids might be less relevant for chronic GVHD prevention in conjunction with PTCy treatment.